
Less wrangling, more insight
Access the latest information and deliver the insights your customer’s expect with the ability to:
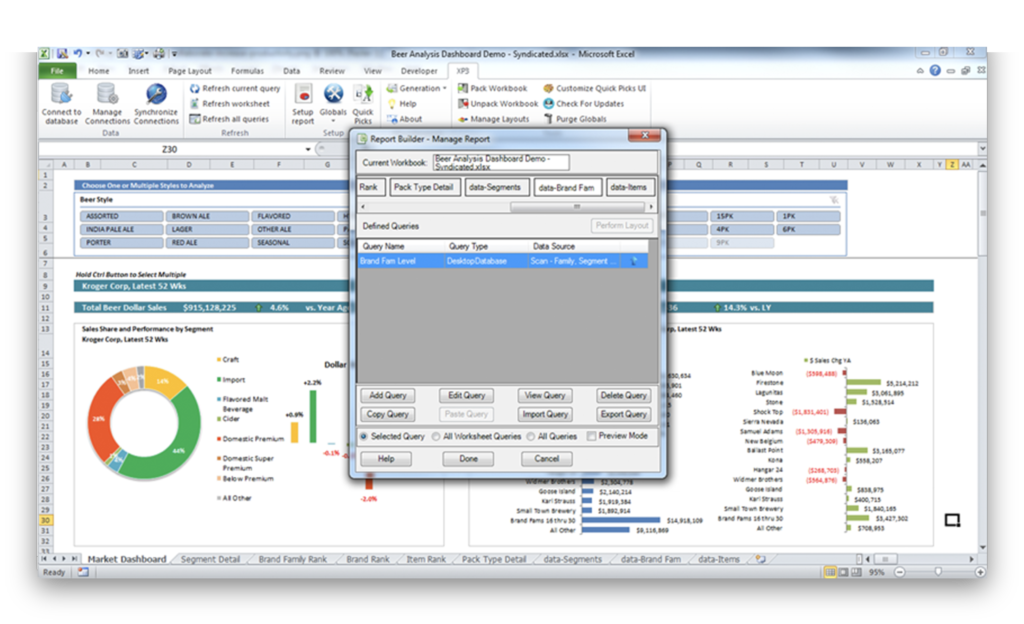
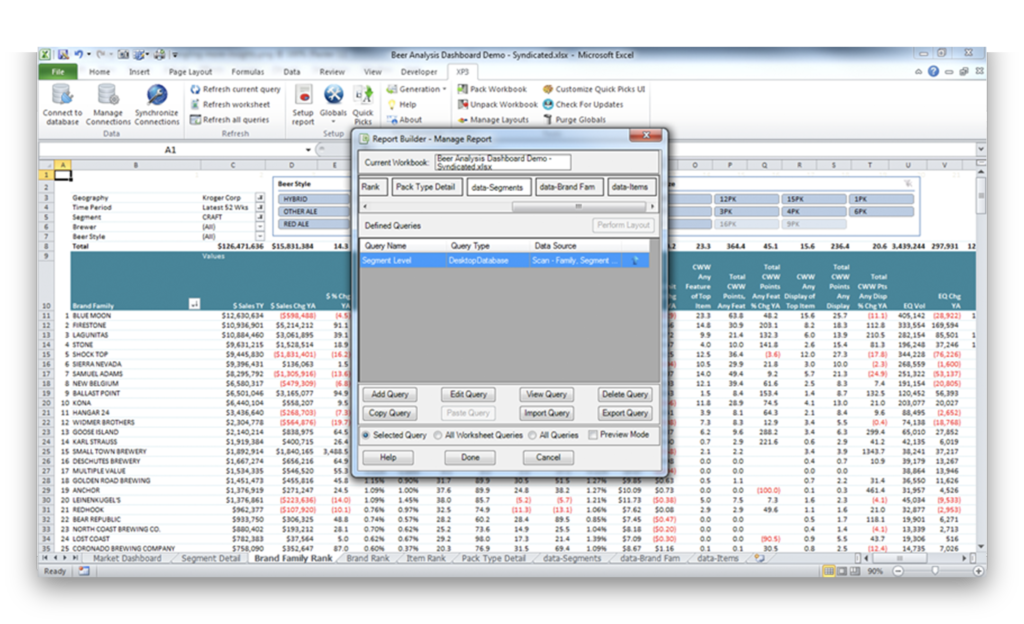
- Modify reports on-the-fly – Users can update individual worksheets or the entire workbook from one dialog box
- Apply custom analytics
- Automatically update data based on user’s selections
XP3 Report Builder’s advanced filtering allows your team to build enhanced pivot tables and apply custom data analysis to their selected fields using an intuitive wizard interface. With XP3®’s added support for pivot tables your team can easily create more advanced reports.

Excel marks the spot
Easily analyze and uncover opportunities through the ability to connect, display and navigate your data with an enriched version of Microsoft Excel.
Enjoy enhanced analytical capabilities and a faster route to actionable business insights through:
- Use Nielsen, IRI, 1010data, SPINS, Numerator data and more
- End-user authoring tool – everything is built in Excel using our Microsoft Office add-in
- Flexible queries – User has the ability to create linked reports across multiple worksheets
- Dynamic Pivot Tables – No need to create macros or manually update Pivot Tables
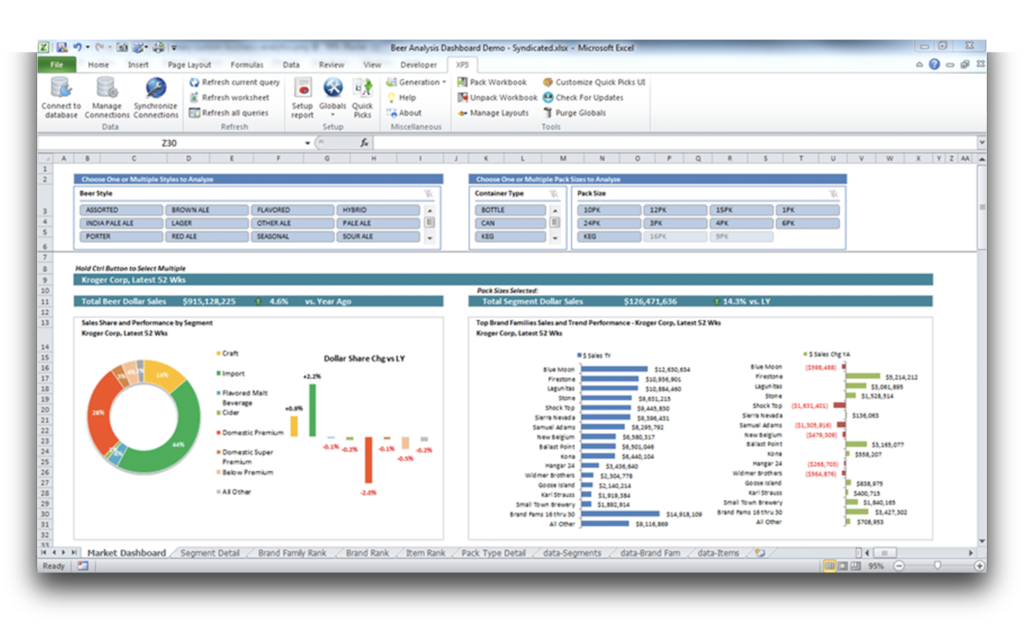
- Customized reporting – Include dynamic Excel charts and slicers in your reports
What’s more, all reports, dashboards and business analytics can be updated with a single mouse click.

Share, collaborate, & increase productivity
XP3® Report Builder™ allows you to:- Share as well as refresh data across multiple reports from a single location
- Create multiple iterations of reports from a ingle interface on a daily, weekly, or monthly basis
As a result, you’ll have plenty of time to create comprehensive and insightful executive dashboards for the unique needs of your companies’ executive leadership team.